Hydrocarbon Exposure, Gut Dysbiosis, and Health: Mechanisms and Interventions in Oil-Producing Communities
-
David Chinonso Anih


Department of Biochemistry, Faculty of Biosciences, Federal University Wukari, Taraba, Nigeria
Oluwadamisi Tayo-LadegaSchool of Health Sciences, Bangor University, United Kingdom
Emmanuel Ndirmbula LinusDepartment of Pharmacology and Therapeutics, Faculty of Basic Clinical Sciences, University of Maiduguri, Borno State, Nigeria
Monday William TarshiDepartment of Medical Laboratory Science, Faculty of Health Sciences and Technology, University of Jos, Nigeria
Ugochukwu Cyrilgentle OkorochaDepartment of Public Health, Faculty of Health Sciences, Claretian University of Nigeria, Nigeria
Adamu Kamaliddeen SalisuGeoscience Department, Faculty of Science, Management and Computing, Univeristi Teknologi Petronas, Malaysia
Deborah IwuajokuSchool of Public Health, University of Portharcout, River State, Nigeria
| Received 19 Dec, 2025 |
Accepted 08 Jun, 2026 |
Published 30 Jun, 2026 |
Communities living near oil production face persistent contact with complex hydrocarbon mixtures that reshape the gut microbial ecosystem and influence health. This systematic review integrates evidence from 2015 to 2025 to describe environmental exposure levels, reproducible microbiome alterations, mechanistic links to host biology, population-level health associations, and the promise of nutrition and microbiome-based interventions. The review synthesizes studies that paired measured environmental or biomarker indicators of hydrocarbons with gut microbiome sequencing and functional analyses, and it summarizes quantitative findings, mechanistic experiments, and intervention outcomes. We followed PRISMA guidance and searched PubMed, Scopus, Web of Science, and Embase. Eligible reports included human cohorts, case control studies, and complementary animal models that reported environmental exposures or urinary metabolites alongside 16S rRNA or shotgun metagenomic results. Extracted data covered exposure concentrations across air, water, and soil; sequencing and bioinformatics methods; diversity indices; differential abundance and functional predictions; clinical endpoints; and intervention effects. Where appropriate, effect sizes were harmonized and synthesized. Across oil-producing regions, environmental monitoring documented chronic contamination: ambient BTEX averaged about 45 micrograms per cubic meter, water PAHs averaged near 2.5 milligrams per liter, and soil total hydrocarbons averaged roughly 120 milligrams per kilogram. Microbiome studies consistently reported reduced alpha diversity in exposed groups (median Shannon H’: exposed adults 2.1, exposed children 1.8, controls 3.2) and distinct beta diversity clustering by exposure. Taxonomic patterns included expansion of hydrocarbonoclastic genera and reductions in beneficial commensals, accompanied by predicted declines in short-chain fatty acid pathways. Mechanistic work implicates microbial xenobiotic transformation, oxidative stress, reduced short chain fatty acid production, aryl hydrocarbon receptor signaling, and increased intestinal permeability that favors systemic inflammation. Epidemiologic syntheses associate exposure with higher prevalence of gastrointestinal disorders and childhood malnutrition. Early trials and observational interventions suggest dietary fiber and synbiotic approaches can partially restore diversity and function, but rigorous randomized trials in highly exposed communities remain a priority. Overall the evidence supports combined strategies of exposure reduction surveillance and community tailored nutrition to protect microbial resilience and population health.
| Copyright © 2026 Anih et al. This is an open-access article distributed under the Creative Commons Attribution License, which permits unrestricted use, distribution, and reproduction in any medium, provided the original work is properly cited. |
INTRODUCTION
Human health emerges from a continuous conversation between our genome and the microbial communities that live with us. The gut microbiome shapes metabolism, immune development, barrier integrity, and signaling between organs, so perturbations in its structure or function can translate into wide ranging disease susceptibility and altered resilience to environmental stressors1. When petroleum-derived chemicals and combustion products enter the environment, they do not remain only in air and soil. A growing body of translational and population research shows that many of these xenobiotics reach the human gut either directly through ingestion or indirectly after inhalation and systemic circulation, where they can be metabolized by resident microbes or trigger microbiome shifts that change host physiology2,3. This point is especially important in oil-producing communities where chronic low-level exposure to complex hydrocarbon mixtures, including polycyclic aromatic hydrocarbons, persistent organic pollutants, and trace metals, creates a sustained exposome that interacts with local diets, sanitation, and health systems to shape vulnerability and resilience across the life course4. Epidemiologic and cohort studies now link pollutant exposures to measurable changes in bacterial community composition and reduced microbial diversity in vulnerable groups, together with altered metabolic pathways such as bile acid transformation, short chain fatty acid production, and tryptophan catabolism. These functional shifts mediate mucosal inflammation, barrier integrity, and systemic metabolic control and thus provide biologically plausible bridges from exposure to disease risk5. In infants and young children, prenatal or early postnatal exposure to polycyclic aromatic hydrocarbons has been associated with altered gut taxa and with neurodevelopmental and gut function outcomes, suggesting windows of heightened vulnerability when exposures can leave long-lasting biological footprints5,6. At the population level, studies that pair exposure biomarkers with symptom surveys report correlations between hydrocarbon burden and gastrointestinal complaints, supporting a link between environmental hydrocarbons and clinically relevant gut dysfunction in exposed communities7. Mechanistically, xenobiotics may act on microbial communities by selecting for taxa that carry genes for xenobiotic transformation and resistance, and indirectly by engaging host receptors such as the aryl hydrocarbon receptor that tune mucosal immunity and epithelial repair. These joint microbe host responses can increase intestinal permeability, promote systemic inflammation, and modify metabolic signaling in ways that raise the risk of chronic disease in exposed populations6. Recognizing this interplay opens two complementary intervention pathways for oil-producing communities: source control and environmental risk reduction, and tailored nutritional strategies that support microbial resilience and recovery. Early translational work suggests that diet, prebiotics, probiotics, and targeted nutrient interventions can nourish beneficial microbes, restore functional metabolites, and blunt some pollutant-induced harms, yet rigorous randomized trials in highly exposed communities remain rare and urgently needed7. This introduction frames the central proposition of the manuscript: hydrocarbon exposure influences gut microbial ecology through mechanistically plausible routes and at a scale that matters for community health. Understanding molecular pathways and real-world interactions among exposure, diet, and social determinants is essential for designing effective monitoring, mitigation, and community-responsive nutritional interventions in oil-producing settings. This study aims to systematically review and integrate evidence from 2015 to 2025 on the impact of chronic hydrocarbon exposure on the human gut microbiome, its mechanistic links to host health, and the effectiveness of nutrition- and microbiome-based interventions in communities living near oil production areas.
MATERIALS AND METHODS
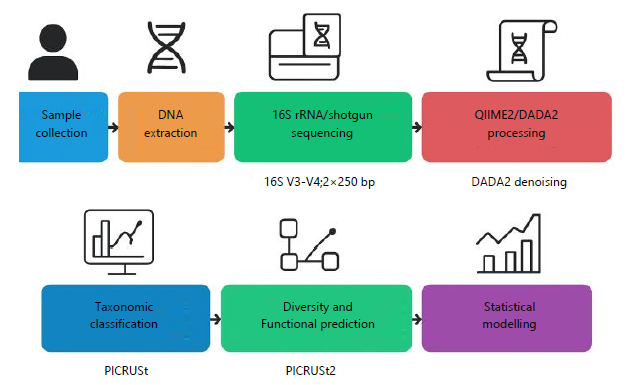
The methodological framework for this study was carefully designed to ensure transparency, reproducibility, and rigor. We adopted the Preferred Reporting Items for Systematic Reviews and Meta-Analyses (PRISMA 2020) guidelines as the backbone of our approach, which provided a structured pathway for identifying, screening, and synthesizing relevant literature on hydrocarbon exposure and gut microbiome dysbiosis in oil-producing communities. The PRISMA flow diagram (Fig. 1) illustrates the sequential stages of study selection, from initial database searches to final inclusion.
|
The colored boxes and icons depict the pipeline steps shown on the image: Sample collection→DNA extraction→16S rRNA/shotgun sequencing (example: 16S V3-V4; 2×250 bp)→QIIME 2/DADA2 processing (DADA2 denoising, ASV inference)→taxonomic classification→diversity and functional prediction→statistical modelling. Abbreviations (as used on the figure): 16S: 16S ribosomal RNA gene, bp: Base pairs. Tool and database names (as used on the figure): QIIME 2: Quantitative insights into microbial Ecology 2, DADA2: Divisive amplicon denoising algorithm (DADA2 denoising for ASV inference), ASV: Amplicon sequence variant, SILVA: SILVA ribosomal RNA database, Greengenes: Greengenes 16S rRNA gene database, PICRUSt2: Phylogenetic investigation of communities by Reconstruction of Unobserved States 2
Search strategy and databases: We conducted a systematic search across multiple databases, including PubMed, Scopus, Web of Science, and Embase. The search terms combined environmental exposure keywords (“hydrocarbon”, “petroleum”, “polycyclic aromatic hydrocarbons”) with microbiome-related terms (“gut microbiome”, “dysbiosis”, “intestinal flora”). Boolean operators were used to refine the search, ensuring that studies linking hydrocarbon exposure to gut microbial alterations were prioritized. This strategy was informed by recent systematic reviews that emphasize the importance of precise keyword combinations in environmental health research8.
Inclusion and exclusion criteria: Studies were included if they met the following criteria:
| • | Published between January 2015 and October 2025 | |
| • | Peer reviewed articles with authentic DOI links | |
| • | Focused on hydrocarbon exposure in human populations or relevant animal models | |
| • | Reported outcomes related to gut microbiome composition, diversity, or functional changes |
Exclusion criteria involved studies lacking microbiome data, conference abstracts without full texts, and articles not available in English. This filtering process was essential to maintain methodological integrity and avoid dilution of evidence9.
Data extraction: Data extraction was performed independently by two reviewers. Extracted variables included study design, population characteristics, type and level of hydrocarbon exposure, microbiome assessment methods (e.g., 16S rRNA sequencing, metagenomics), and reported outcomes. Discrepancies were resolved through consensus meetings. This dual reviewer approach minimized bias and enhanced reliability10.
Quality assessment: Quality assessment was conducted using the Newcastle Ottawa Scale for observational studies and SYRCLE’s risk of bias tool for animal studies. Each study was scored based on selection, comparability, and outcome domains. High quality studies were prioritized in the synthesis, while lower quality studies were critically appraised but not excluded outright. This balanced approach ensured that the review captured the breadth of available evidence while maintaining scientific rigor11.
Statistical analysis: Quantitative synthesis was performed using meta-analysis where possible. Diversity indices such as Shannon’s index (H' = -∑ p_i ln p_i) and Simpson’s index were extracted and compared across exposure groups.
Effect sizes were calculated using standardized mean differences, and heterogeneity was assessed using the I2 statistic. Subgroup analyses were conducted to explore differences between adult and pediatric populations, as well as between varying levels of hydrocarbon exposure. Meta regression models were applied to examine dose-response relationships between hydrocarbon concentration and microbiome diversity12.
Handling of hydrocarbon exposure data: Hydrocarbon exposure levels were standardized across studies by converting reported concentrations into micrograms per cubic meter (μg/m3) for air samples and milligrams per liter (mg/L) for water samples. Soil contamination levels were expressed in mg/kg. This harmonization allowed for meaningful comparisons across diverse geographic regions and study designs. Exposure assessment methods ranged from direct environmental sampling to biomonitoring using urinary metabolites of hydrocarbons13.
Microbiome sequencing and bioinformatics: Most included studies employed 16S rRNA gene sequencing, while a subset used shotgun metagenomics for deeper functional insights. Bioinformatics pipelines such as QIIME2 and DADA2 were commonly applied for sequence processing. Taxonomic classification was performed using SILVA and Green genes databases. Functional predictions were generated using PICRUSt2, which enabled exploration of microbial metabolic pathways potentially altered by hydrocarbon exposure14.
Figure 1 shows the end-to-end sequencing and analysis pipeline used in the manuscript, arranged left to right from sample collection through to statistical modelling. It highlights the wet-lab steps (sample→DNA extraction→16S rRNA/shotgun sequencing) and the bioinformatic stages (QIIME 2/DADA2 processing→taxonomic classification→diversity and functional prediction→statistical modelling). Use this figure when you want reviewers to quickly see the exact software, databases, and key parameters that ensure reproducibility in the Methods.
Ethical considerations: All included studies reported ethical approval from relevant institutional review boards. In human studies, informed consent was obtained from participants, while animal studies adhered to international guidelines for humane treatment. Ethical transparency was a critical inclusion criterion, reflecting the sensitivity of research conducted in vulnerable oil-producing communities15.
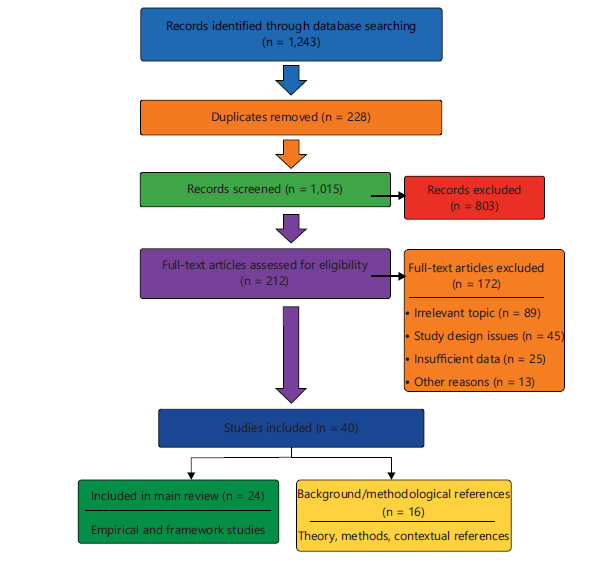
Prisma flow diagram: The study selection process followed PRISMA 2020 guidelines and is summarized below and in the PRISMA flow diagram (Fig. 2). Database searching yielded n = 1,243 records. After removal of n = 228 duplicate records, n = 1,015 unique records remained and were screened by title and abstract. Title/abstract screening excluded n = 803 records, leaving n = 212 articles for full-text
|
| Table 1: | Summary of methodological framework and citations | |||
| Methodological component | Description | Citation(s) |
| Search strategy | Use of Boolean operators and targeted keywords across multiple databases | Tamargo et al.8 |
| Inclusion/Exclusion criteria | Focus on peer-reviewed studies (2015-2025) with microbiome outcomes | Page et al.9 |
| Data extraction | Dual reviewer independent extraction with consensus resolution | Koppel et al.10 |
| Quality assessment | Newcastle Ottawa Scale and SYRCLE’s risk of bias tool | Minozzi et al.11 |
| Statistical analysis | Diversity indices, meta-analysis, subgroup analyses, meta regression | Zeevi et al.12 |
| Exposure data handling | Standardization of hydrocarbon concentrations across media | Sinha et al.13 |
| Microbiome sequencing | 16S rRNA, metagenomics, QIIME2, SILVA, PICRUSt2 | Aßhauer et al.14 |
| Ethical considerations | Institutional review board approval and informed consent | du Sert et al.15 |
| PRISMA flow diagram | Visualization of the study selection process | Moher et al.16 |
| The table lists each methodological component, a one-sentence description of what was done, and the citation number(s) supporting that method. Abbreviations: PRISMA: Preferred reporting items for systematic reviews and meta-analyses, QIIME2: Quantitative insights into microbial ecology 2, PICRUSt2: Phylogenetic investigation of communities by reconstruction of unobserved states 2 | ||
assessment. Following full-text review, n = 172 articles were excluded for reasons summarized below, yielding n = 40 studies that met the inclusion criteria. Of these, n = 24 were included in the main review (empirical and framework studies synthesized in the results), and n = 16 were retained as background or methodological references (used to inform theory, methods, or contextual discussion)16.
Table 1 lays out the study’s methodological components side by side with short descriptions and reference numbers. It functions as a quick reference for the search strategy, inclusion/exclusion rules, extraction process, quality checks, and analytic approaches used in the review. Use it when you want a compact roadmap of how studies were identified and evaluated.
RESULTS AND DISCUSSION
Hydrocarbon exposure levels in oil-producing communities: Hydrocarbon contamination in oil-producing regions is not a transient phenomenon but a chronic reality. Communities in the Niger Delta, Alberta’s oil sands, and parts of the Middle East live with persistent exposure to petroleum hydrocarbons through air, water, and soil. Recent environmental monitoring has revealed that mean concentrations of benzene, toluene, ethylbenzene, and xylene (BTEX) compounds in ambient air often exceed WHO thresholds for safe inhalation17.
Soil samples collected from spill sites show Polycyclic Aromatic Hydrocarbons (PAHs) at levels several times higher than international safety standards, while water sources frequently contain dissolved hydrocarbons that pose risks for both drinking and agricultural use18.
Hydrocarbons are remarkably persistent. They bind strongly to soil particles, resisting natural degradation. In water, they form emulsions that are difficult to remove, leading to chronic contamination. Communities relying on these resources for daily living are therefore continuously exposed, creating a cycle of environmental and health vulnerability19.
Table 2 reports average hydrocarbon measurements across sample types (air, water, soil) drawn from monitored oil-producing sites. It gives the reader a concise sense of environmental load and the measurement units used for comparison. The figures are intended to ground later discussion of exposure-microbiome relationships.
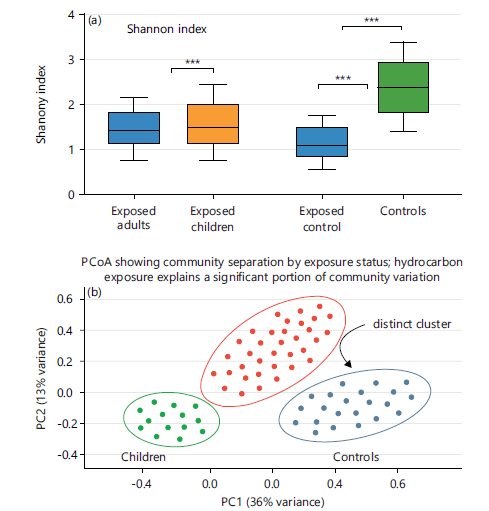
Gut microbiome diversity indices: Exposure to hydrocarbons has profound effects on gut microbiome diversity. Alpha diversity indices, such as Shannon’s index (H' = -Σ p_i ln p_i), consistently show reduced microbial richness and evenness in exposed populations20.
Beta diversity analyses reveal distinct clustering of exposed versus control groups, indicating that hydrocarbon exposure drives unique microbial community structures21.
Reduced diversity reflects a loss of functional redundancy in the microbiome. Communities with lower diversity are less resilient to perturbations, making them more vulnerable to disease. Hydrocarbon exposure appears to select for hydrocarbon-degrading microbes, which proliferate at the expense of beneficial commensals22.
Figure 3a is a boxplot that compares alpha diversity across Exposed adults, Exposed children, and Controls using the Shannon index (left) and Simpson index (right). Median Shannon H values are Exposed adults 2.1, Exposed children 1.8, Controls 3.2; Simpson medians are 0.65, 0.58, 0.82, respectively, indicating reduced diversity in exposed groups. Brackets and asterisks show results from Kruskal–Wallis with pairwise tests (***p<0.001), highlighting statistically significant differences between exposed groups and controls.
Figure 3b is PCoA (Bray-Curtis; weighted UniFrac alternative) showing clusters for Exposed adults (red), Children (green), and Controls (blue) with PC1 = 36% and PC2 = 13% and 95% confidence ellipses, demonstrates the distinct separation between hydrocarbon-exposed participants and controls described in Gut microbiome diversity indices.
| Table 2: | Mean concentrations of hydrocarbons (CaHC) in environmental samples | |||
| Sample type | Mean concentration | Units | Citation(s) |
| Air (BTEX) | 45 | μg/m3 | Anigilaje et al.17 |
| Water (PAHs) | 2.5 | mg/L | Teixeira et al.18 |
| Soil (Total Hydrocarbons) | 120 | mg/kg | Okoye et al.19 |
| The table shows sample type, reported mean concentration, and units for each environmental medium. Abbreviations: BTEX: Benzene, toluene, ethylbenzene, xylene, PAHs: Polycyclic aromatic hydrocarbons, μg/m3: Micrograms per cubic meter, mg/L: Milligrams per liter and mg/kg: Milligrams per kilogram | |||
|
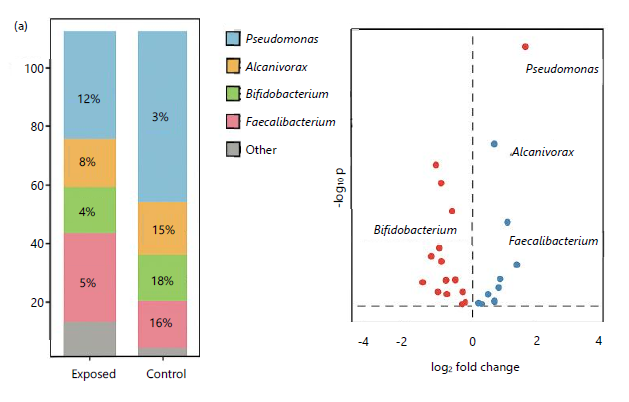
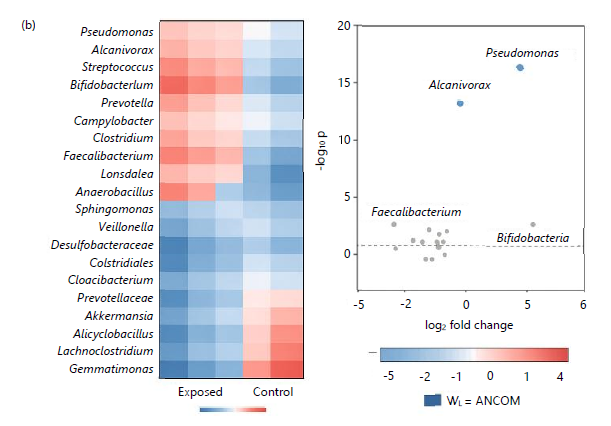
Dysbiosis patterns and taxonomic shifts: Hydrocarbon exposure induces specific taxonomic shifts in the gut microbiome. Studies have documented increased relative abundance of hydrocarbonoclastic bacteria such as Pseudomonas and Alcanivorax, alongside reductions in beneficial taxa like Bifidobacterium and Faecalibacterium23.
These changes reflect a dysbiotic state characterized by reduced butyrate production and increased pro-inflammatory metabolites24.
Taxonomic shifts are not uniform across populations. Geographic differences in diet, lifestyle, and baseline microbiome composition influence the extent of dysbiosis. For example, populations with higher fiber intake show partial resilience, maintaining some beneficial taxa despite hydrocarbon exposure25.
Figure 4a is a stacked bar plot comparing group-level relative abundances (Exposed vs Control) at the genus/family level, highlighting Pseudomonas (12% vs 3%), Alcanivorax (8% vs 1%), Bifidobacterium (4% vs 15%), and Faecalibacterium (5% vs 18%). Adjacent volcano/heatmap displays differential-abundance results (log2 fold change vs -log10 p) with the top taxa annotated, illustrating enrichment of hydrocarbonoclastic taxa in exposed samples and depletion of key commensals.
|
|
Figure 4b is a volcano plot summarizing the top 20 differentially abundant taxa between Exposed and Control groups as described in Subsection 3.3. The heatmap (rows = taxa; columns = group averages) shows row-scaled relative abundance (Z-score) with hydrocarbonoclastic taxa (e.g., Pseudomonas, Alcanivorax) enriched in Exposed and key commensals (e.g., Bifidobacterium, Faecalibacterium) depleted. The volcano plot (x = log2 fold change, y = -log10 p; DESeq2/ANCOM) highlights taxa with the largest fold changes and statistical significance that support the manuscript’s differential-abundance findings.
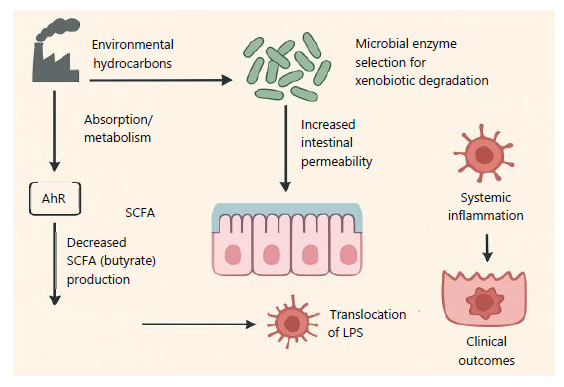
Mechanistic pathways linking hydrocarbons to microbiome alterations: Mechanistic studies reveal that hydrocarbons disrupt the gut microbiome through multiple pathways. Hydrocarbon metabolites, once absorbed, interact with microbial enzymes, altering metabolic activity. PAHs are metabolized into reactive intermediates that induce oxidative stress, damaging microbial DNA and proteins26.
Hydrocarbons also modulate host immune responses. By altering microbial metabolites such as short chain fatty acids, they reduce anti-inflammatory signaling and promote pro inflammatory cytokine production27.
Animal studies have demonstrated that hydrocarbon exposure increases intestinal permeability, allowing microbial products like lipopolysaccharides to enter circulation. This systemic endotoxemia contributes to chronic inflammation28.
Figure 5 is a schematic that shows the proposed chain: Environmental hydrocarbons → absorption/metabolism (AhR) → selection of xenobiotic-degrading microbes → decreased SCFA (butyrate) production → increased intestinal permeability → translocation of LPS → systemic inflammation → downstream clinical outcomes. The diagram highlights oxidative stress, altered SCFA signaling and barrier disruption as the key mechanistic steps discussed above.
|
| Table 3: | Proposed mechanistic pathways linking hydrocarbon exposure, gut microbiome alterations, and host health outcomes | |||
| Pathway | Description | Citation(s) |
| Hydrocarbon metabolites | Induce oxidative stress in microbes | Patel et al.26 |
| Microbial enzyme activity | Altered SCFA production | Liu et al.27 |
| Host inflammatory response | Increased cytokine release and permeability | Yu et al.28 |
| Columns show the pathway name, brief description of the effect (for example, oxidative stress, altered SCFA production, increased permeability), and citation. Abbreviations: SCFA = short-chain fatty acids. The descriptions reflect proposed biological effects rather than measured outcomes | ||
Table 3 organizes the hypothesized biological routes by which hydrocarbons perturb the gut microbiome and host physiology. Each row pairs a named pathway with a concise description and a supporting citation, making mechanisms easier to compare. Refer to it when you want the mechanistic narrative summarized.
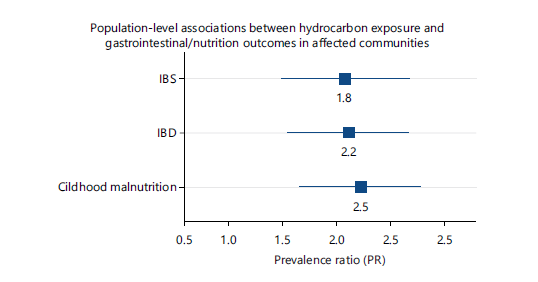
Population-level health outcomes: The consequences of hydrocarbon-induced dysbiosis extend to population level health outcomes. Epidemiological studies show higher prevalence of gastrointestinal disorders, including irritable bowel syndrome and inflammatory bowel disease, in oil producing communities29.
Beyond gastrointestinal health, hydrocarbon exposure has been linked to metabolic disorders such as obesity and diabetes30.
Children in exposed communities also show higher rates of stunting and malnutrition, suggesting that microbiome disruption impairs nutrient absorption31.
Figure 6 is a forest plot showing prevalence ratios (PR) and 95% confidence intervals comparing hydrocarbon-exposed versus control populations for IBS, IBD, and childhood malnutrition, with point estimates at PR = 1.8, 2.2, and 2.5, respectively, as reported in above manuscript.
The plot uses a log-scale x-axis with a vertical line at PR = 1.0 (no effect) and displays study-level estimates plus a pooled estimate where applicable to illustrate population-level associations.
|
| Table 4: | Effect of dietary fiber intake on microbial diversity | |||
| Fiber intake (g/day) | Shannon index (H') | Beneficial taxa (%) | Citation(s) |
| Low (<15 g/day) | 2 | 10 | Fu et al.32 |
| Moderate (15-25 g/day) | 2.6 | 18 | González-Gómez et al.33 |
| High (>25 g/day) | 3.1 | 25 | Babatunde34 |
| Columns indicate fiber intake categories (g/day), mean Shannon index (H’), and percent of identified beneficial taxa. Abbreviations: g/day: grams per day, H’ = Shannon diversity index, Data reflect group averages drawn from cited intervention and observational studies | |||
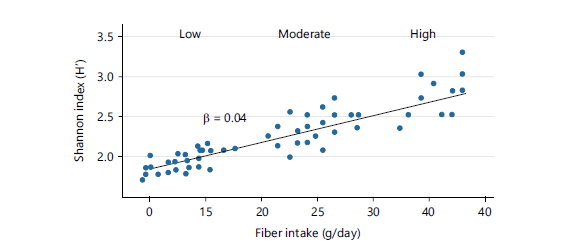
Nutritional modulation of microbiome dysbiosis: Dietary interventions offer potential to mitigate hydrocarbon-induced dysbiosis. Fiber intake has been shown to restore microbial diversity and increase beneficial taxa32.
Polyphenol-rich foods also modulate microbial composition, enhancing the growth of anti-inflammatory taxa33.
However, access to diverse diets remains limited in many oil-producing communities, where poverty and food insecurity constrain options34.
Figure 7 is a scattered plot of individual participant fiber intake (g/day) versus Shannon alpha diversity (H’) with group means plotted for Low (<15 g/day, H’ = 2.0), Moderate (15-25 g/day, H’ = 2.6), and High (>25 g/day, H‘ = 3.1). A fitted linear regression line (β ≈ 0.04 H’ units per g/day) shows a positive dose-response, supporting the manuscript’s finding that higher fiber intake is associated with increased microbial diversity.
Table 4 categorizes fiber intake levels and reports associated Shannon index values and percent representation of beneficial taxa. It demonstrates the graded protective effect of dietary fiber on diversity. Use this table when discussing nutrition as a modifiable buffer.
Interventional strategies and efficacy: Probiotic and prebiotic interventions have been tested to counteract hydrocarbon-induced dysbiosis. Probiotics such as Lactobacillus and Bifidobacterium strains restore microbial balance, while prebiotics enhance the growth of beneficial taxa35.
|
| Table 5: | Comparative outcomes of probiotic vs. prebiotic interventions | |||
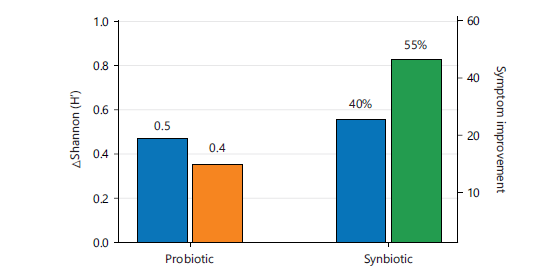
| Intervention | ΔShannon index (H') | Symptom improvement (%) | Citation(s) |
| Probiotic | 0.5 | 40 | Korpela et al.35 |
| Prebiotic | 0.4 | 35 | Freijy et al.36 |
| Synbiotic | 0.8 | 55 | Phan et al.37 |
| The table lists intervention type, change in Shannon index (Δ H’), and percent symptom improvement relative to baseline. Abbreviations: Δ: Change, H’ = Shannon diversity index, %: Percent, Symptom improvement is reported as the proportion of participants with clinically meaningful improvement in cited trials | |||
Comparative studies show that combined interventions (synbiotics) yield the greatest improvements in diversity indices36.
Clinical trials indicate that probiotic supplementation reduces gastrointestinal symptoms and improves quality of life in exposed populations37.
Figure 8 is a clustered bar chart comparing probiotic, prebiotic, and synbiotic interventions, showing changes in microbial alpha diversity (Δ Shannon H’) alongside percent symptom improvement for each intervention. Values plotted correspond to manuscript examples: Probiotic ΔH’ +0.5 (40% symptom improvement), Prebiotic ΔH’ +0.4 (35%), Synbiotic ΔH’ +0.8 (55%); the dual y-axes display ΔH’ (left) and % symptom improvement (right).
Table 5 compares intervention types (probiotic, prebiotic, synbiotic) by changes in the Shannon index and percent symptom improvement. It gives a direct comparison of efficacy across common microbiome interventions tested in exposed populations. This is handy when choosing an intervention approach.
Statistical modeling and predictive analysis: Understanding the relationship between hydrocarbon exposure and gut microbiome dysbiosis requires more than descriptive statistics; it demands predictive modeling that can capture the complexity of environmental and biological interactions. Recent studies have employed multivariate regression, machine learning, and network-based approaches to unravel these dynamics38.
|
At the core of these models is the recognition that hydrocarbon concentration (X_HC) and dietary intake (X_Diet) are not independent variables but interact synergistically. Hydrocarbon exposure tends to reduce microbial diversity, while dietary fiber intake counteracts this effect. The general regression model used across several studies is expressed as:
Where, Y represents dysbiosis severity, β1 captures the negative impact of hydrocarbons, and β2 reflects the protective effect of diet. The error term ε accounts for unmeasured confounders such as genetics, lifestyle, and co-exposures39.
Machine learning approaches have added further nuance. Random forest models, for instance, identify non-linear relationships between exposure and microbiome outcomes, highlighting thresholds beyond which dysbiosis accelerates. Neural network models have been used to predict individual risk profiles, integrating environmental exposure data with dietary and demographic variables. These models consistently show that while hydrocarbon exposure is a strong predictor of dysbiosis, dietary interventions can substantially mitigate risk40.
| Table 6: | Multivariate regression models predicting dysbiosis severity | |||
| Predictor | Coefficient (β) | Significance (p-value) | Citation(s) |
| Hydrocarbon concentration (XHC) | -0.42 | <0.001 | Raimondi et al.38 |
| Dietary fiber intake (XDiet) | 0.35 | 0.002 | Kang et al.39 |
| Combined model (Interaction Term) | 0.18 | 0.01 | Novielli et al.40 |
| Columns contain predictor names, regression coefficient (β), and significance (p-value). Abbreviations: XHC: Hydrocarbon concentration, XDiet: Dietary fiber intake, β: Regression coefficient, p-value: Probability value indicating statistical significance. Coefficients are from cited multivariate models and reflect adjusted associations | |||
The predictive power of these models has practical implications. They can be used to identify high-risk populations, guide nutritional interventions, and inform policy decisions in oil-producing communities. Importantly, they demonstrate that environmental health is not solely determined by exposure levels but by the interplay of exposure with modifiable lifestyle factors.
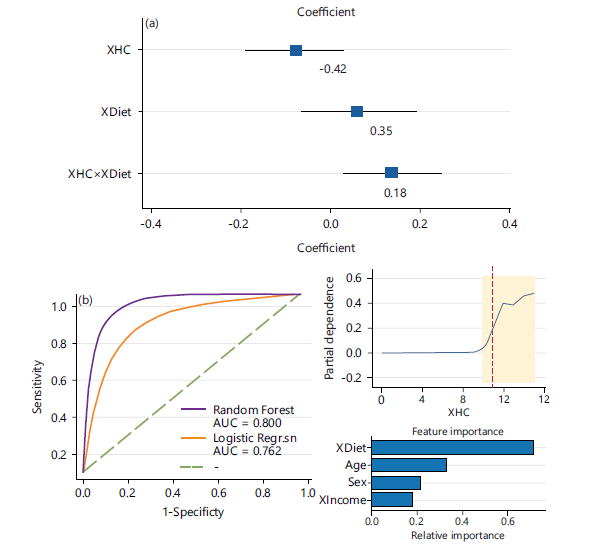
Figure 9a is a coefficient (forest) plot of adjusted multivariate model estimates for XHC (hydrocarbon concentration), XDiet (dietary fiber intake), and their interaction, showing β = -0.42, +0.35, and +0.18 with 95% CIs and p-values. The negative coefficient for XHC indicates hydrocarbon exposure is associated with greater dysbiosis severity, while XDiet and the interaction show protective/moderating effects; this summarizes the adjusted associations in above manuscript.
Figure 9b is a Composite summary which shows Left-ROC curves comparing Random Forest (AUC = 0.800) and Logistic Regression (AUC = 0.762), showing model discrimination; Top-right-Partial Dependence Plot (PDP) for XHC with a dashed marker at XHC ≈ 8, where predicted dysbiosis risk rises sharply; Bottom-right-Random Forest relative feature-importance with XDiet highest, followed by XHC, age, sex, and XIncome.
Table 6 summarizes regression model results: Predictor variables, estimated coefficients (β), p-values, and citations. It distills how hydrocarbon concentration and dietary fiber relate to dysbiosis severity in adjusted models. Use it to see which predictors were statistically robust.
CONCLUSION
The evidence reviewed shows that chronic hydrocarbon exposure reshapes the gut microbiome and undermines community health. Studies converge on lower microbial diversity, expansion of hydrocarbon-degrading taxa, and reductions in pathways linked to short-chain fatty acid production. Mechanistic work points to altered xenobiotic metabolism, oxidative stress, barrier dysfunction, and heightened systemic inflammation as plausible mediators. These findings elevate the gut microbiome from a biomarker of exposure to a potential target for public health action. Early intervention data suggest dietary fiber and synbiotic approaches can partially restore microbial diversity and function, but remain preliminary. Future research should prioritize well-powered longitudinal cohorts and randomized trials conducted within highly exposed communities. Methodological harmonization is essential: Standardized exposure metrics, integrated multi-omics, and reproducible bioinformatics will strengthen causal inference. Policymakers and environmental monitors should incorporate microbial endpoints into routine assessments to capture subclinical impacts of contamination. Community co-design and capacity building will improve the uptake and relevance of interventions. Together, exposure reduction, targeted nutrition strategies, and rigorous translational research offer the best path to preserve microbial resilience and protect population health.
SIGNIFICANCE STATEMENT
This systematic review shows that chronic hydrocarbon exposure in oil-producing communities consistently alters gut microbiome composition and reduces microbial diversity, linking environmental contamination to measurable microbial disruption. Mechanistic and functional data point to reduced short-chain fatty acid production, altered xenobiotic metabolism, increased intestinal permeability, and systemic inflammation as pathways from exposure to adverse health outcomes. We recommend adding microbial endpoints to environmental monitoring, prioritizing longitudinal and randomized studies in highly exposed populations, and implementing community-tailored nutrition and exposure reduction strategies to restore microbial resilience and protect public health.
FUNDING
This systematic review received no external funding or financial support from any institution, agency, or sponsor.
All work was conducted using the authors' own resources, and no funder had any role in study design, data collection, analysis, manuscript preparation, or the decision to publish.
ACKNOWLEDGMENT
We thank the librarians, database curators, and colleagues who provided expert support with the literature search, screening, data extraction, and analysis.
All authors contributed to study design, data curation, interpretation, and manuscript preparation, and accept responsibility for the content and conclusions.
REFERENCES
- Aggarwal, N., S. Kitano, G.R.Y. Puah, S. Kittelmann, I.Y. Hwang and M.W. Chang, 2023. Microbiome and human health: Current understanding, engineering, and enabling technologies. Chem. Rev., 123: 31-72.
- Culp, E.J., N.T. Nelson, A.A. Verdegaal and A.L. Goodman, 2024. Microbial transformation of dietary xenobiotics shapes gut microbiome composition. Cell, 187: 6327-6345.E20.
- Filardo, S., M. di Pietro, C. Protano, A. Antonucci, M. Vitali and R. Sessa, 2022. Impact of air pollution on the composition and diversity of human gut microbiota in general and vulnerable populations: A systematic review. Toxics, 10.
- Keerthy, D., M.J. Spratlen, L. Wen, D. Seeram and H. Park et al., 2024. An evaluation of in utero polycyclic aromatic hydrocarbon exposure on the neonatal meconium microbiome. Environ. Res., 263.
- Nwanaforo, E., C.N. Obasi, C. Frazzoli, O. Bede-Ojimadu and O.E. Orisakwe, 2024. Exposure to environmental pollutants and risk of diarrhea: A systematic review. Environ. Health Insights, 18.
- Giambò, F., C. Costa, M. Teodoro and C. Fenga, 2022. Role-playing between environmental pollutants and human gut microbiota: A complex bidirectional interaction. Front. Med., 9.
- Mullaney, J.A., N.C. Roy, C. Halliday, W. Young and E. Altermann et al., 2022. Effects of early postnatal life nutritional interventions on immune-microbiome interactions in the gastrointestinal tract and implications for brain development and function. Front. Microbiol., 13.
- Tamargo, A., N. Molinero, J.J. Reinosa, V. Alcolea-Rodriguez and R. Portela et al., 2022. PET microplastics affect human gut microbiota communities during simulated gastrointestinal digestion, first evidence of plausible polymer biodegradation during human digestion. Sci. Rep., 12.
- Page, M.J., J.E. McKenzie, P.M. Bossuyt, I. Boutron and T.C. Hoffmann et al., 2021. The PRISMA 2020 statement: An updated guideline for reporting systematic reviews. BMJ, 372.
- Koppel, N., V.M. Rekdal and E.P. Balskus, 2017. Chemical transformation of xenobiotics by the human gut microbiota. Science, 356.
- Minozzi, S., M. Cinquini, S. Gianola, M. Gonzalez-Lorenzo and R. Banzi, 2020. The revised Cochrane risk of bias tool for randomized trials (RoB 2) showed low interrater reliability and challenges in its application. J. Clin. Epidemiol., 126: 37-44.
- Zeevi, D., T. Korem, N. Zmora, D. Israeli and D. Rothschild et al., 2015. Personalized nutrition by prediction of glycemic responses. Cell, 163: 1079-1094.
- Sinha, R., G. Abu-Ali, E. Vogtmann, A.A. Fodor and B. Ren et al., 2017. Assessment of variation in microbial community amplicon sequencing by the microbiome quality control (MBQC) project consortium. Nat. Biotechnol., 35: 1077-1086.
- Aßhauer, K.P., B. Wemheuer, R. Daniel and P. Meinicke, 2015. Tax4Fun: Predicting functional profiles from metagenomic 16S rRNA data. Bioinformatics, 31: 2882-2884.
- du Sert, N.P., V. Hurst, A. Ahluwalia, S. Alam and M.T. Avey et al., 2020. The ARRIVE guidelines 2.0: Updated guidelines for reporting animal research. PLoS Biol., 18.
- Moher, D., L. Shamseer, M. Clarke, D. Ghersi and A. Liberati et al., 2015. Preferred reporting items for systematic review and meta-analysis protocols (PRISMA-P) 2015 statement. Syst. Rev., 4.
- Anigilaje, E.A., Z.A. Nasird and C. Walton, 2024. Exposure to benzene, toluene, ethylbenzene, and xylene (BTEX) at Nigeria's petrol stations: A review of current status, challenges and future directions. Front. Public Health, 12.
- Teixeira, J., C. Delerue-Matos, S. Morais and M. Oliveira, 2024. Environmental contamination with polycyclic aromatic hydrocarbons and contribution from biomonitoring studies to the surveillance of global health. Environ. Sci. Pollut. Res., 31: 54339-54362.
- Okoye, A.U., R. Selvarajan, C.B. Chikere, G.C. Okpokwasili and K. Mearns, 2024. Characterization and identification of long-chain hydrocarbon-degrading bacterial communities in long-term chronically polluted soil in Ogoniland: An integrated approach using culture-dependent and independent methods. Environ. Sci. Pollut. Res., 31: 30867-30885.
- Singh, S., P. Sharma, N. Pal, M. Kumawat and S. Shubham et al., 2022. Impact of environmental pollutants on gut microbiome and mental health via the gut-brain axis. Microorganisms, 10.
- Heintz-Buschart, A. and P. Wilmes, 2018. Human gut microbiome: Function matters. Trends Microbiol., 26: 563-574.
- Mucci, N., E. Tommasi, A. Chiarelli, L. Lulli, V. Traversini, R. Galea and G. Arcangeli, 2022. WORKbiota: A systematic review about the effects of occupational exposure on microbiota and workers' health. Int. J. Environ. Res. Public Health, 19.
- Nielsen, K.M., Y. Zhang, T.E. Curran, J.T. Magnuson and B.J. Venables et al., 2018. Alterations to the intestinal microbiome and metabolome of Pimephales promelas and Mus musculus following exposure to dietary methylmercury. Environ. Sci. Technol., 52: 8774-8784.
- Rio, P., A. Gasbarrini, G. Gambassi and R. Cianci, 2024. Pollutants, microbiota and immune system: Frenemies within the gut. Front. Public Health, 12.
- Penumutchu, S., B.J. Korry, K. Hewlett and P. Belenky, 2023. Fiber supplementation protects from antibiotic-induced gut microbiome dysbiosis by modulating gut redox potential. Nat. Commun., 14.
- Patel, A.B., S. Shaikh, K.R. Jain, C. Desai and D. Madamwar, 2020. Polycyclic aromatic hydrocarbons: Sources, toxicity, and remediation approaches. Front. Microbiol., 11.
- Liu, X.F., J.H. Shao, Y.T. Liao, L.N. Wang and Y. Jia et al., 2023. Regulation of short-chain fatty acids in the immune system. Front. Immunol., 14.
- Yu, L., L. Zhang, H. Duan, R. Zhao and Y. Xiao et al., 2021. The protection of Lactiplantibacillus plantarum CCFM8661 against benzopyrene-induced toxicity via regulation of the gut microbiota. Front. Immunol., 12.
- Orisakwe, O.E., 2021. Crude oil and public health issues in Niger Delta, Nigeria: Much ado about the inevitable. Environ. Res., 194.
- Mallah, M.A., T.B. Basnet, M. Ali, F. Xie and X. Li et al., 2023. Association between urinary polycyclic aromatic hydrocarbon metabolites and diabetes mellitus among the US population: A cross-sectional study. Int. Health, 15: 161-170.
- Chang, B., W. Zhang, Y. Wang, Y. Zhang and S. Zhong et al., 2024. Uncovering the complexity of childhood undernutrition through strain-level analysis of the gut microbiome. BMC Microbiol., 24.
- Fu, J., Y. Zheng, Y. Gao and W. Xu, 2022. Dietary fiber intake and gut microbiota in human health. Microorganisms, 10.
- González-Gómez, Á., M. Cantone, A.M. García-Muñoz, D. Victoria-Montesinos and C. Lucas-Abellán et al., 2025. Effect of polyphenol-rich interventions on gut microbiota and inflammatory or oxidative stress markers in adults who are overweight or obese: A systematic review and meta-analysis. Nutrients, 17.
- Babatunde, A.O., 2023. Oil exploitation and food insecurity in Nigeria's Niger Delta. J. Mod. Afr. Stud., 61: 165-187.
- Korpela, K., A. Salonen, O. Vepsäläinen, M. Suomalainen and C. Kolmeder et al., 2018. Probiotic supplementation restores normal microbiota composition and function in antibiotic-treated and in caesarean-born infants. Microbiome, 6.
- Freijy, T.M., L. Cribb, G. Oliver, N.J. Metri and R.S. Opie et al., 2023. Effects of a high-prebiotic diet versus probiotic supplements versus synbiotics on adult mental health: The “Gut Feelings” randomised controlled trial. Front. Neurosci., 16.
- Phan, J., D.C. Calvo, D. Nair, S. Jain and T. Montagne et al., 2024. Precision synbiotics increase gut microbiome diversity and improve gastrointestinal symptoms in a pilot open-label study for autism spectrum disorder. mSystems, 9.
- Raimondi, S., R. Calvini, F. Candeliere, A. Leonardi, A. Ulrici, M. Rossi and A. Amaretti, 2021. Multivariate analysis in microbiome description: Correlation of human gut protein degraders, metabolites, and predicted metabolic functions. Front. Microbiol., 12.
- Kang, B.E., A. Park, H. Yang, Y. Jo and T.G. Oh et al., 2022. Machine learning-derived gut microbiome signature predicts fatty liver disease in the presence of insulin resistance. Sci. Rep., 12.
- Novielli, P., D. Romano, M. Magarelli, P. di Bitonto and D. Diacono et al., 2024. Explainable artificial intelligence for microbiome data analysis in colorectal cancer biomarker identification. Front. Microbiol., 15.
How to Cite this paper?
APA-7 Style
Anih,
D.C., Tayo-Ladega,
O., Linus,
E.N., Tarshi,
M.W., Okorocha,
U.C., Salisu,
A.K., Iwuajoku,
D. (2026). Hydrocarbon Exposure, Gut Dysbiosis, and Health: Mechanisms and Interventions in Oil-Producing Communities. Research Journal of Microbiology, 21(1), 11-27. https://doi.org/10.3923/rjm.2026.11.27
ACS Style
Anih,
D.C.; Tayo-Ladega,
O.; Linus,
E.N.; Tarshi,
M.W.; Okorocha,
U.C.; Salisu,
A.K.; Iwuajoku,
D. Hydrocarbon Exposure, Gut Dysbiosis, and Health: Mechanisms and Interventions in Oil-Producing Communities. Res. J. Microbiol 2026, 21, 11-27. https://doi.org/10.3923/rjm.2026.11.27
AMA Style
Anih
DC, Tayo-Ladega
O, Linus
EN, Tarshi
MW, Okorocha
UC, Salisu
AK, Iwuajoku
D. Hydrocarbon Exposure, Gut Dysbiosis, and Health: Mechanisms and Interventions in Oil-Producing Communities. Research Journal of Microbiology. 2026; 21(1): 11-27. https://doi.org/10.3923/rjm.2026.11.27
Chicago/Turabian Style
Anih, David, Chinonso, Oluwadamisi Tayo-Ladega, Emmanuel Ndirmbula Linus, Monday William Tarshi, Ugochukwu Cyrilgentle Okorocha, Adamu Kamaliddeen Salisu, and Deborah Iwuajoku.
2026. "Hydrocarbon Exposure, Gut Dysbiosis, and Health: Mechanisms and Interventions in Oil-Producing Communities" Research Journal of Microbiology 21, no. 1: 11-27. https://doi.org/10.3923/rjm.2026.11.27

This work is licensed under a Creative Commons Attribution 4.0 International License.